
Language

Sell-through rate is the share of units received that sold in a set period: units sold divided by units received, times 100. Receive 800 polos, sell 360 in six weeks, and six-week sell-through is 45%. Track it weekly, split by full price and by size. The F* Word helps upstream with trend validation and tech packs in 8 to 10 minutes.
Sell-through rate is the number most chase, hold and markdown calls start from. On its own it hides a lot: the time window, the share sold on discount, and the sizes that never moved. This guide covers the formula and its variants, how to read it week by week, what published benchmarks say, and how product decisions made months earlier shape it. For the wider launch process, see our merchandising and launch workflow guide.
The standard formula is units sold divided by units received in the same period, multiplied by 100. SPS Commerce, which runs retail supply chain data for brands and retailers, gives the same formula and recommends reviewing it weekly during the selling season, by style, color and size.
Take a knit polo. The brand receives 800 units and sells 360 in the first six weeks, so six-week sell-through is 360 divided by 800, or 45%. The style has 440 units left. At the current pace of 60 units a week, the remaining stock covers a bit more than seven weeks of sales, which is the figure called weeks of supply.
For a continuing style that already had stock on the shelf, add the opening inventory to the receipts before you divide. Retail Plan, a merchandise planning guide, puts the cleanest version as net units sold divided by net units sold plus ending on hand. That works out to the same base when nothing but sales moved the stock, and it avoids a common mistake: dividing by opening stock alone or by receipts alone when both exist.
Benchmarks mean little without the time window next to them. AIMS360, an apparel ERP vendor, compiles published benchmarks and finds that most land between about 60% and 85% for a season. Its point is the one to hold on to: 60% after two weeks is a hit, while 60% at the end of the season is a markdown problem.
Many US apparel buyers work to a rule of thumb that a style should be tracking toward roughly 80% sell-through at full price by the end of its planned selling season, or a markdown becomes hard to avoid. MBA Training, which teaches retail finance, describes this as a widely cited heuristic with no regulated standard behind it, and notes that thresholds vary by retailer, category and season length. Fast fashion plans tighter windows, while department stores plan longer ones.
The safest benchmark is your own history. Pull the weekly curve for the last three seasons of a category, find the curves that ended in a clean full-price sell-out, and use their shape as next season's plan.
Total sell-through counts every unit sold, at any price. Full-price sell-through counts only units sold before any discount. The gap between them is the margin story. RetailNorthstar, a retail planning resource, gives a worked example of two tees that both received 1,000 units and both sold 620 by week six.
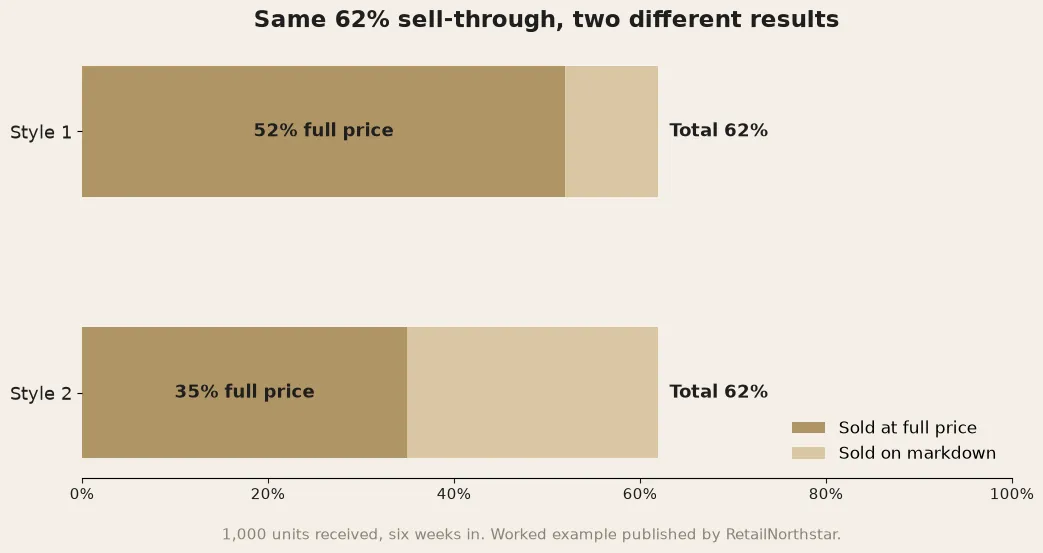
The first tee sold 520 units at full price and 100 on a first markdown, so its full-price sell-through is 52% and it is a candidate for a reorder. The second sold 350 at full price and 270 on markdown. Its total is the same 62%, but only 35% sold at full price, and the discount did most of the work. A report that shows only the total would rank them as equals.
Teams use several related numbers, and the names get mixed up in weekly trade meetings. The table sets out the common versions and when each one earns its place on the report.

Plotted week by week, cumulative sell-through makes a curve, and the slope in the first few weeks tells you most of what you need. The chart below shows three styles on a 12-week season. At the week 4 read, Style A is ahead of plan at about 8.5% a week, Style B sits on a 6% a week plan, and Style C sells about 3% a week.
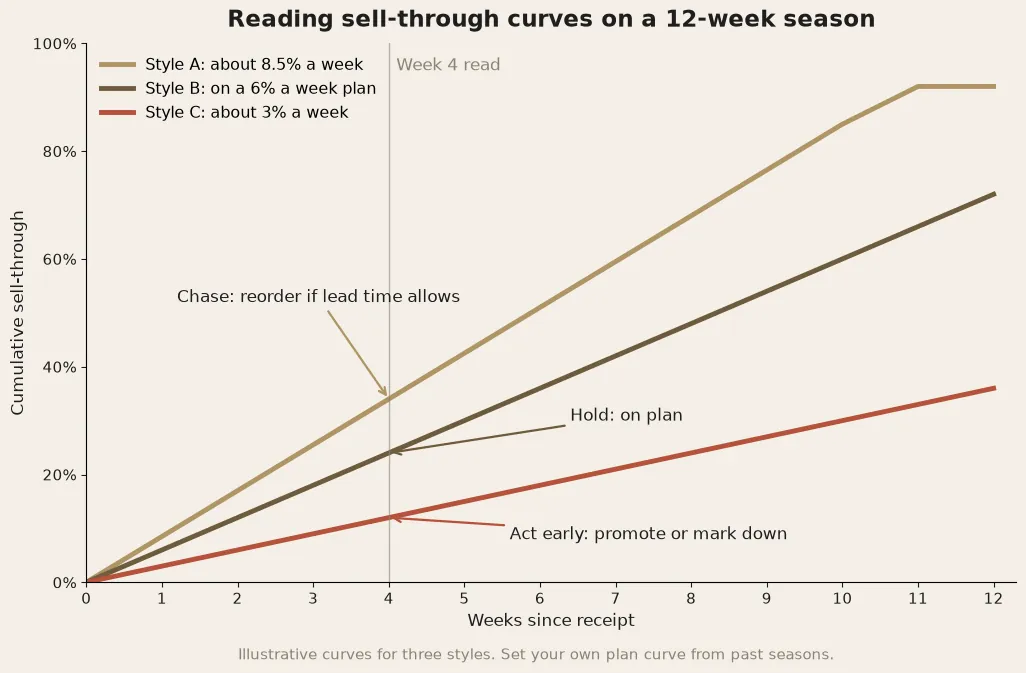
Each curve points to a different action. Style A is a chase candidate if the factory can turn a reorder before demand fades. No action is needed on Style B. Style C needs attention early, through a better product page, a placement change, or a first markdown, because a style selling 3% a week will end the season with most of its stock left. Waiting for a fixed week 8 markdown date costs margin on Style A and comes too late for Style C.
A healthy style total can hide a size run that failed. If a jacket sells 70% overall but only 20% in XL, the brand bought too many XL units, and next season's size ratio should change. SPS Commerce makes the same point about doors and styles: a chain-wide average can hide problems already hurting sales in specific stores.
When you roll sell-through up from sizes, colors or stores, add the units and divide once. Averaging the percentages gives a small door with 40 units the same weight as a flagship with 4,000. Retail Plan treats summing units, never averaging percentages, as a basic rule, and most planning tools follow it.
Wholesale brands track two numbers. Sell-in counts the units a retailer buys from the brand. Sell-through counts the units that retailer sells to shoppers. A brand can post a strong season of sell-in and still lose the account, because a buyer who is left holding stock at the end of the season cuts the next order or asks for markdown money.
Ask accounts for weekly sell-through by style and size, and agree the reporting format before the season starts. Many retailers share it through a vendor portal or an EDI feed. The brands that read it early can offer a reorder on a hot style or a promotion on a slow one while the season still has weeks to run.
Low sell-through usually traces back to a decision made before the product arrived, and the common causes fall into five groups.
Only the last cause can be fixed in season. The rest are product development and planning decisions, which is why merchandisers who want better sell-through end up spending time upstream. Our guide on whether trend intelligence can reduce overproduction covers the buying side in more depth.
The F* Word does not calculate sell-through. It works on the decisions that shape it. Trend analysis and validation checks whether a signal is real before a team commits units to it, so the buy rests on evidence instead of last season's numbers. Our guide to AI line review tools covers how merchandisers put that evidence in front of a line review.
Speed matters for the chase. The F* Word generates a factory-ready tech pack in 8 to 10 minutes from a sketch, photo or brief, with points of measure, grading, tolerances and a bill of materials. A new style that tests well in a small first drop can reach the factory sooner, and a clear spec cuts the fit problems that come back as returns. It works before or alongside a PLM and does not replace one.
Related: SKU rationalization · merchandising calendar · tech pack automation for merchandising · assortment planning
Divide units sold by units received in the same period and multiply by 100. For styles with stock already on hand, add opening inventory to receipts before you divide.
Published apparel benchmarks mostly land between about 60% and 85% for a season, and many buyers aim for around 80% at full price. Compare against your own past curves for the same category and window.
Sell-in is what a retailer buys from a brand. Sell-through is what that retailer sells to shoppers. Strong sell-in with weak sell-through usually leads to smaller reorders or markdown claims.
No. Sell-through measures the share of a buy that sold in a window. Inventory turnover measures how many times stock is sold and replaced over a year, usually from cost of goods sold and average inventory.
Validate trends before setting buy depth, set size ratios from past size-level sell-through, and send complete specs to cut fit returns. The F* Word validates trend signals and generates tech packs in 8 to 10 minutes.
Get The F* Word workflow insights in your inbox.